Aggregating Smart Home data/control using node-red
Aggregating Smart Home data/control using node-red
my first adventure into the smart home world was a nest, it was the first thing i could control from my phone. talk about life changing. then came smartthings, which is a decent platform in itself, but then add google home, rachio, smart meters, weather stations, and the 50 other different vendors that are part of your home.
this documents my integrations, and how i use them with node-red, dashboards around the house, and google home.
node-red is described as Flow-based programming for the Internet of Things
it can run in a container, rpi, or install it on a server somewhere. It has access control for security, can be an endpoint for api requests, but by far the best part is the shear number of plugins that exist. here is a list of just some of the ones that i use.
smartthings integration
i started my poolBot project a few years ago, and back then i wrote a whole UI and dashboard, and a bunch of extra stuff to have it easy to manage. then i couldn't really figure out how to get it tie into the rest of the house. i had smart things by this point, and i knew there had to be a better way.
smart things requires a script, or better a docker container and mqtt. its called smartthings-mqtt-bridge. it allows you to ingest and inject data with smartthings and have control of your devices, and get their state changes.
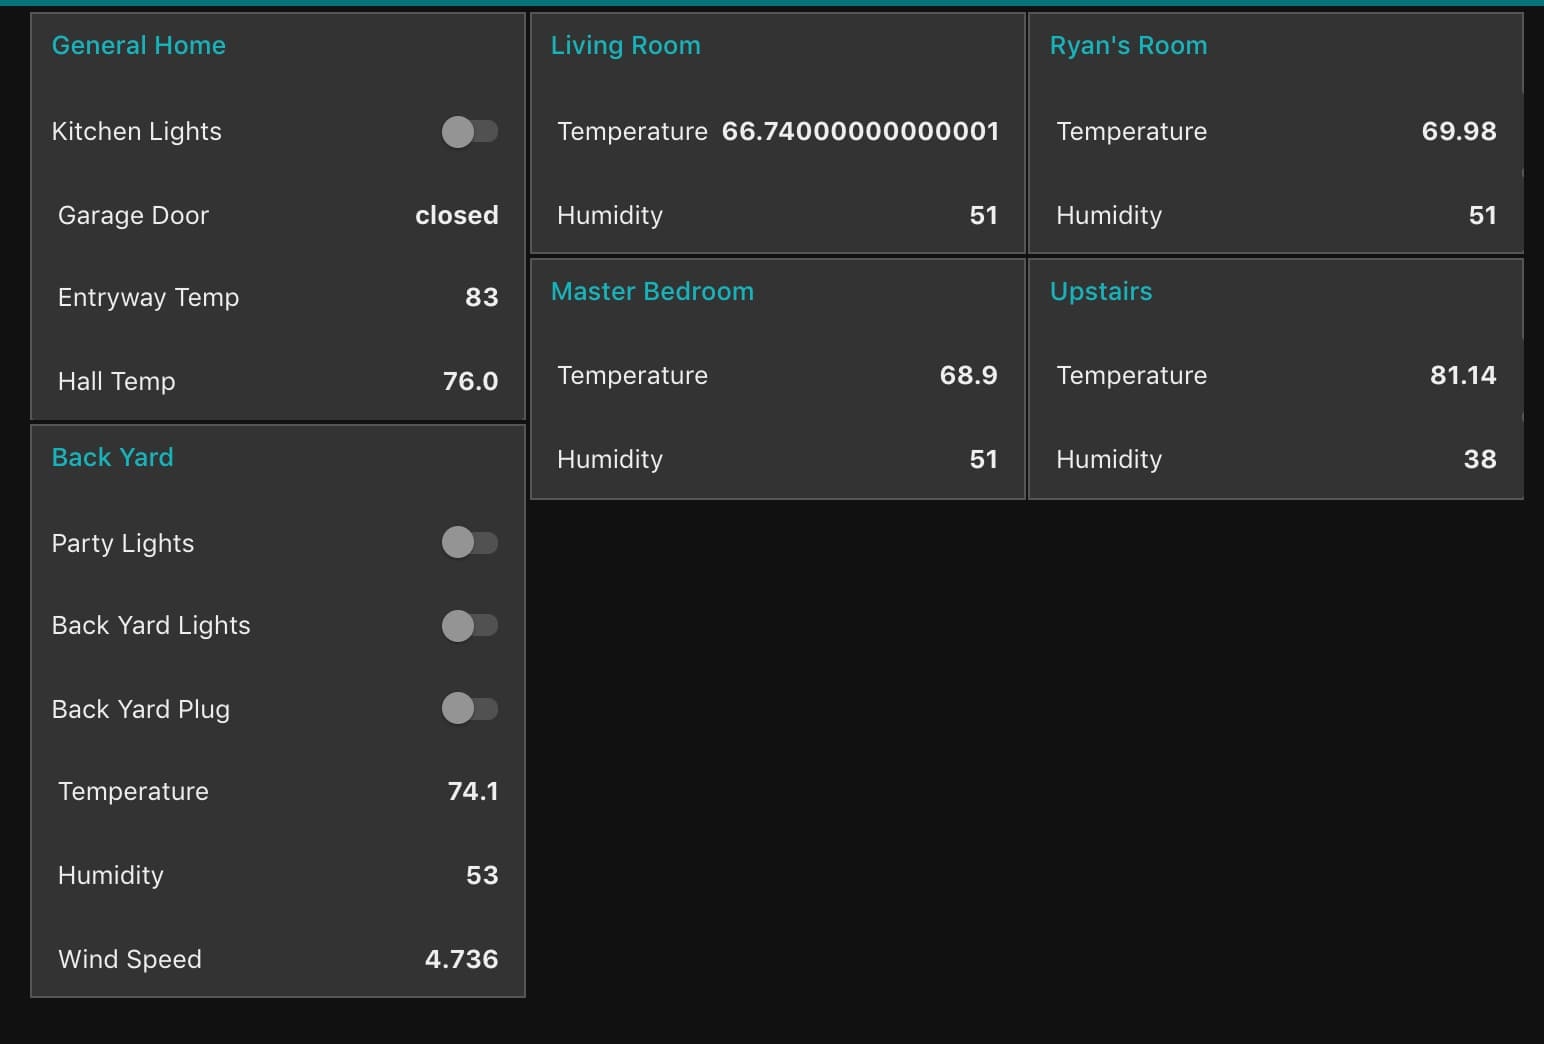
with the dashboard plugin you can then build simple interfaces like this
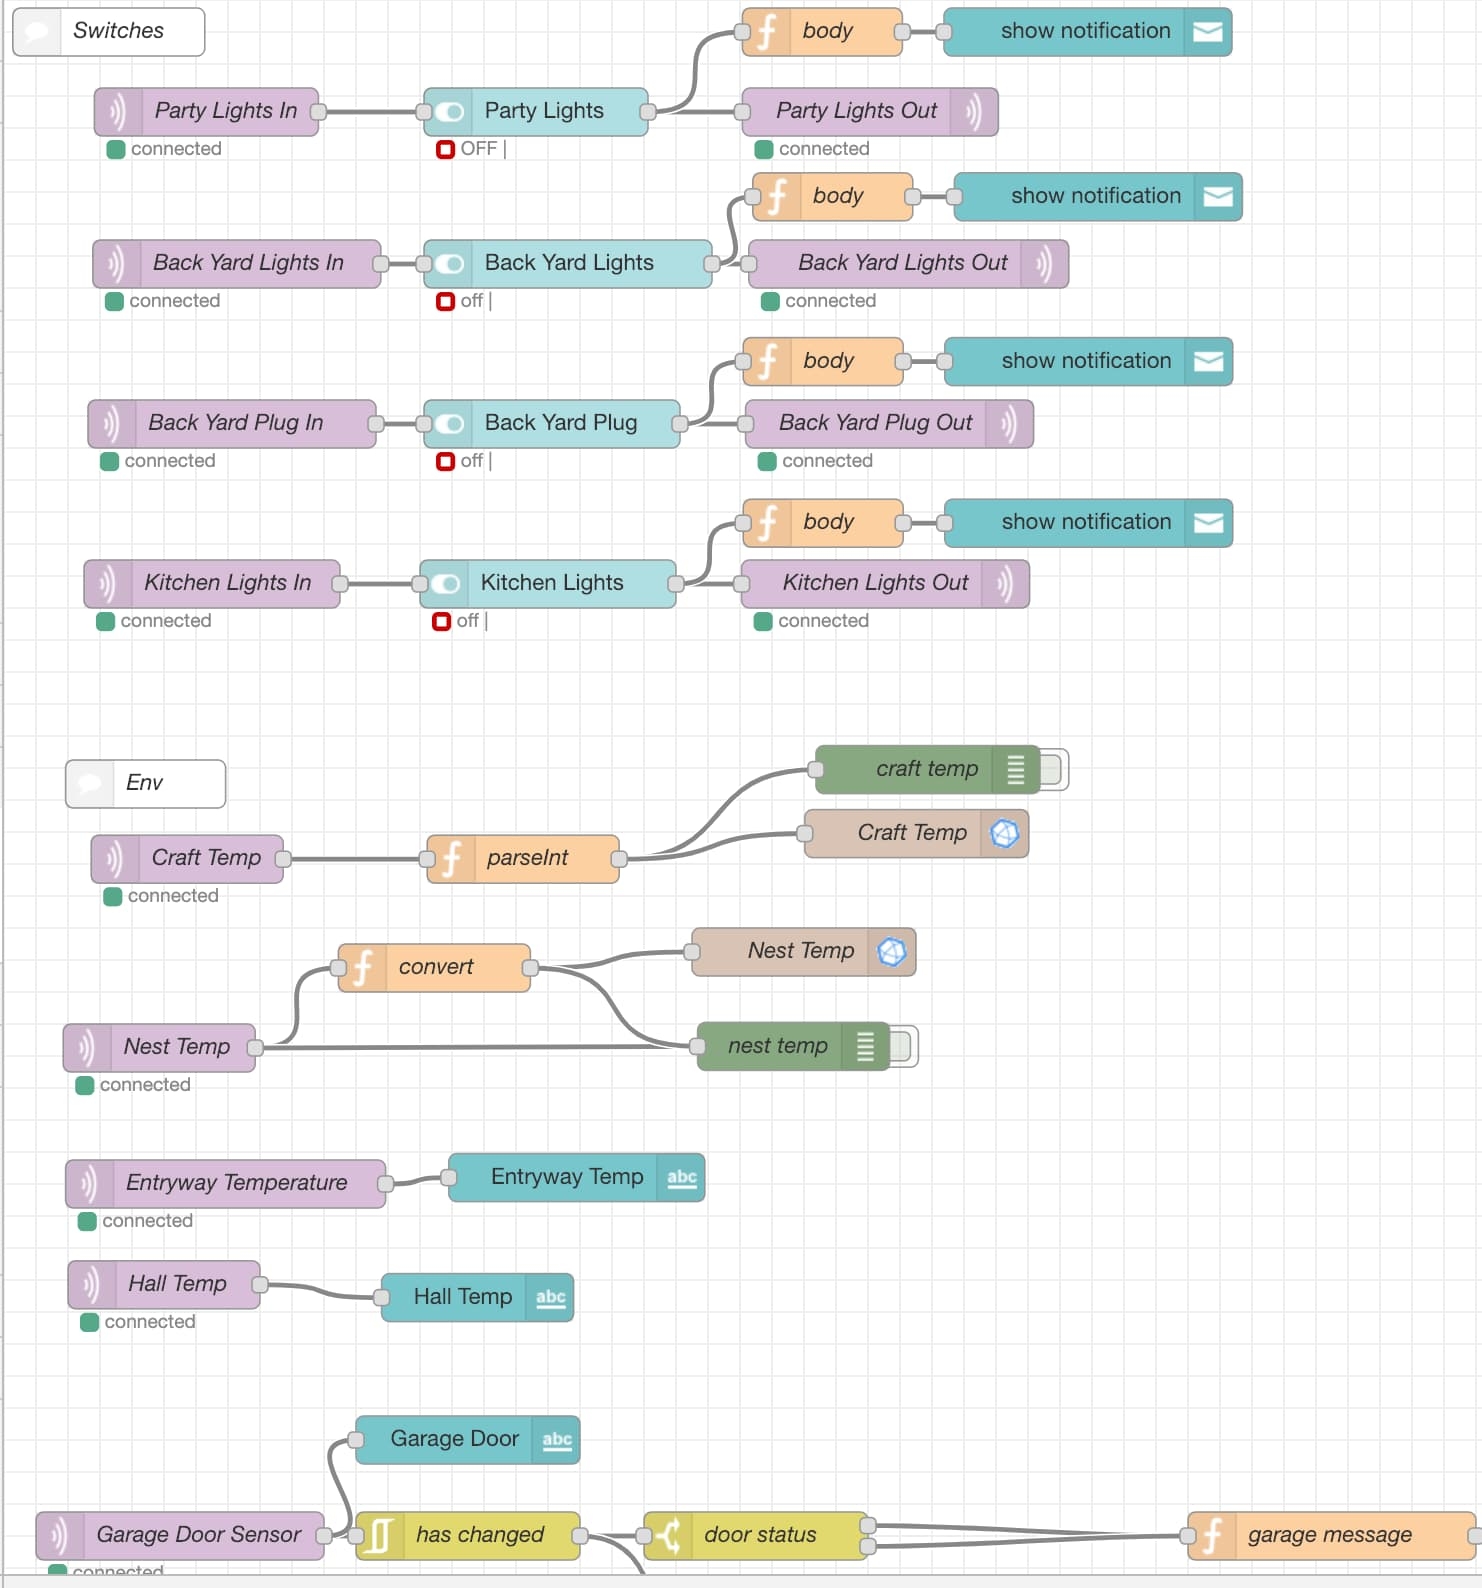
using flows like this
electric utility smart meter
i have socal edison for my electrical utility. they put a smart meter on the side of the house, but require a authorized device to read the data in realtime. enter rainforestmeter.
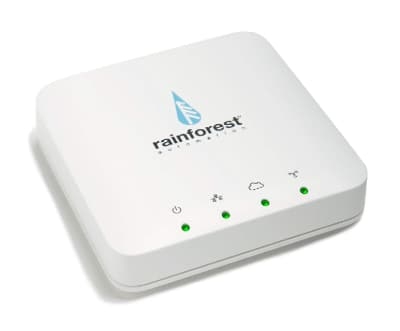
this box connects to the utilities meter via zigbee, and can feed data to various api endpoints. a lot are paid, or require some large contract, but it does allow you to put your own url in.
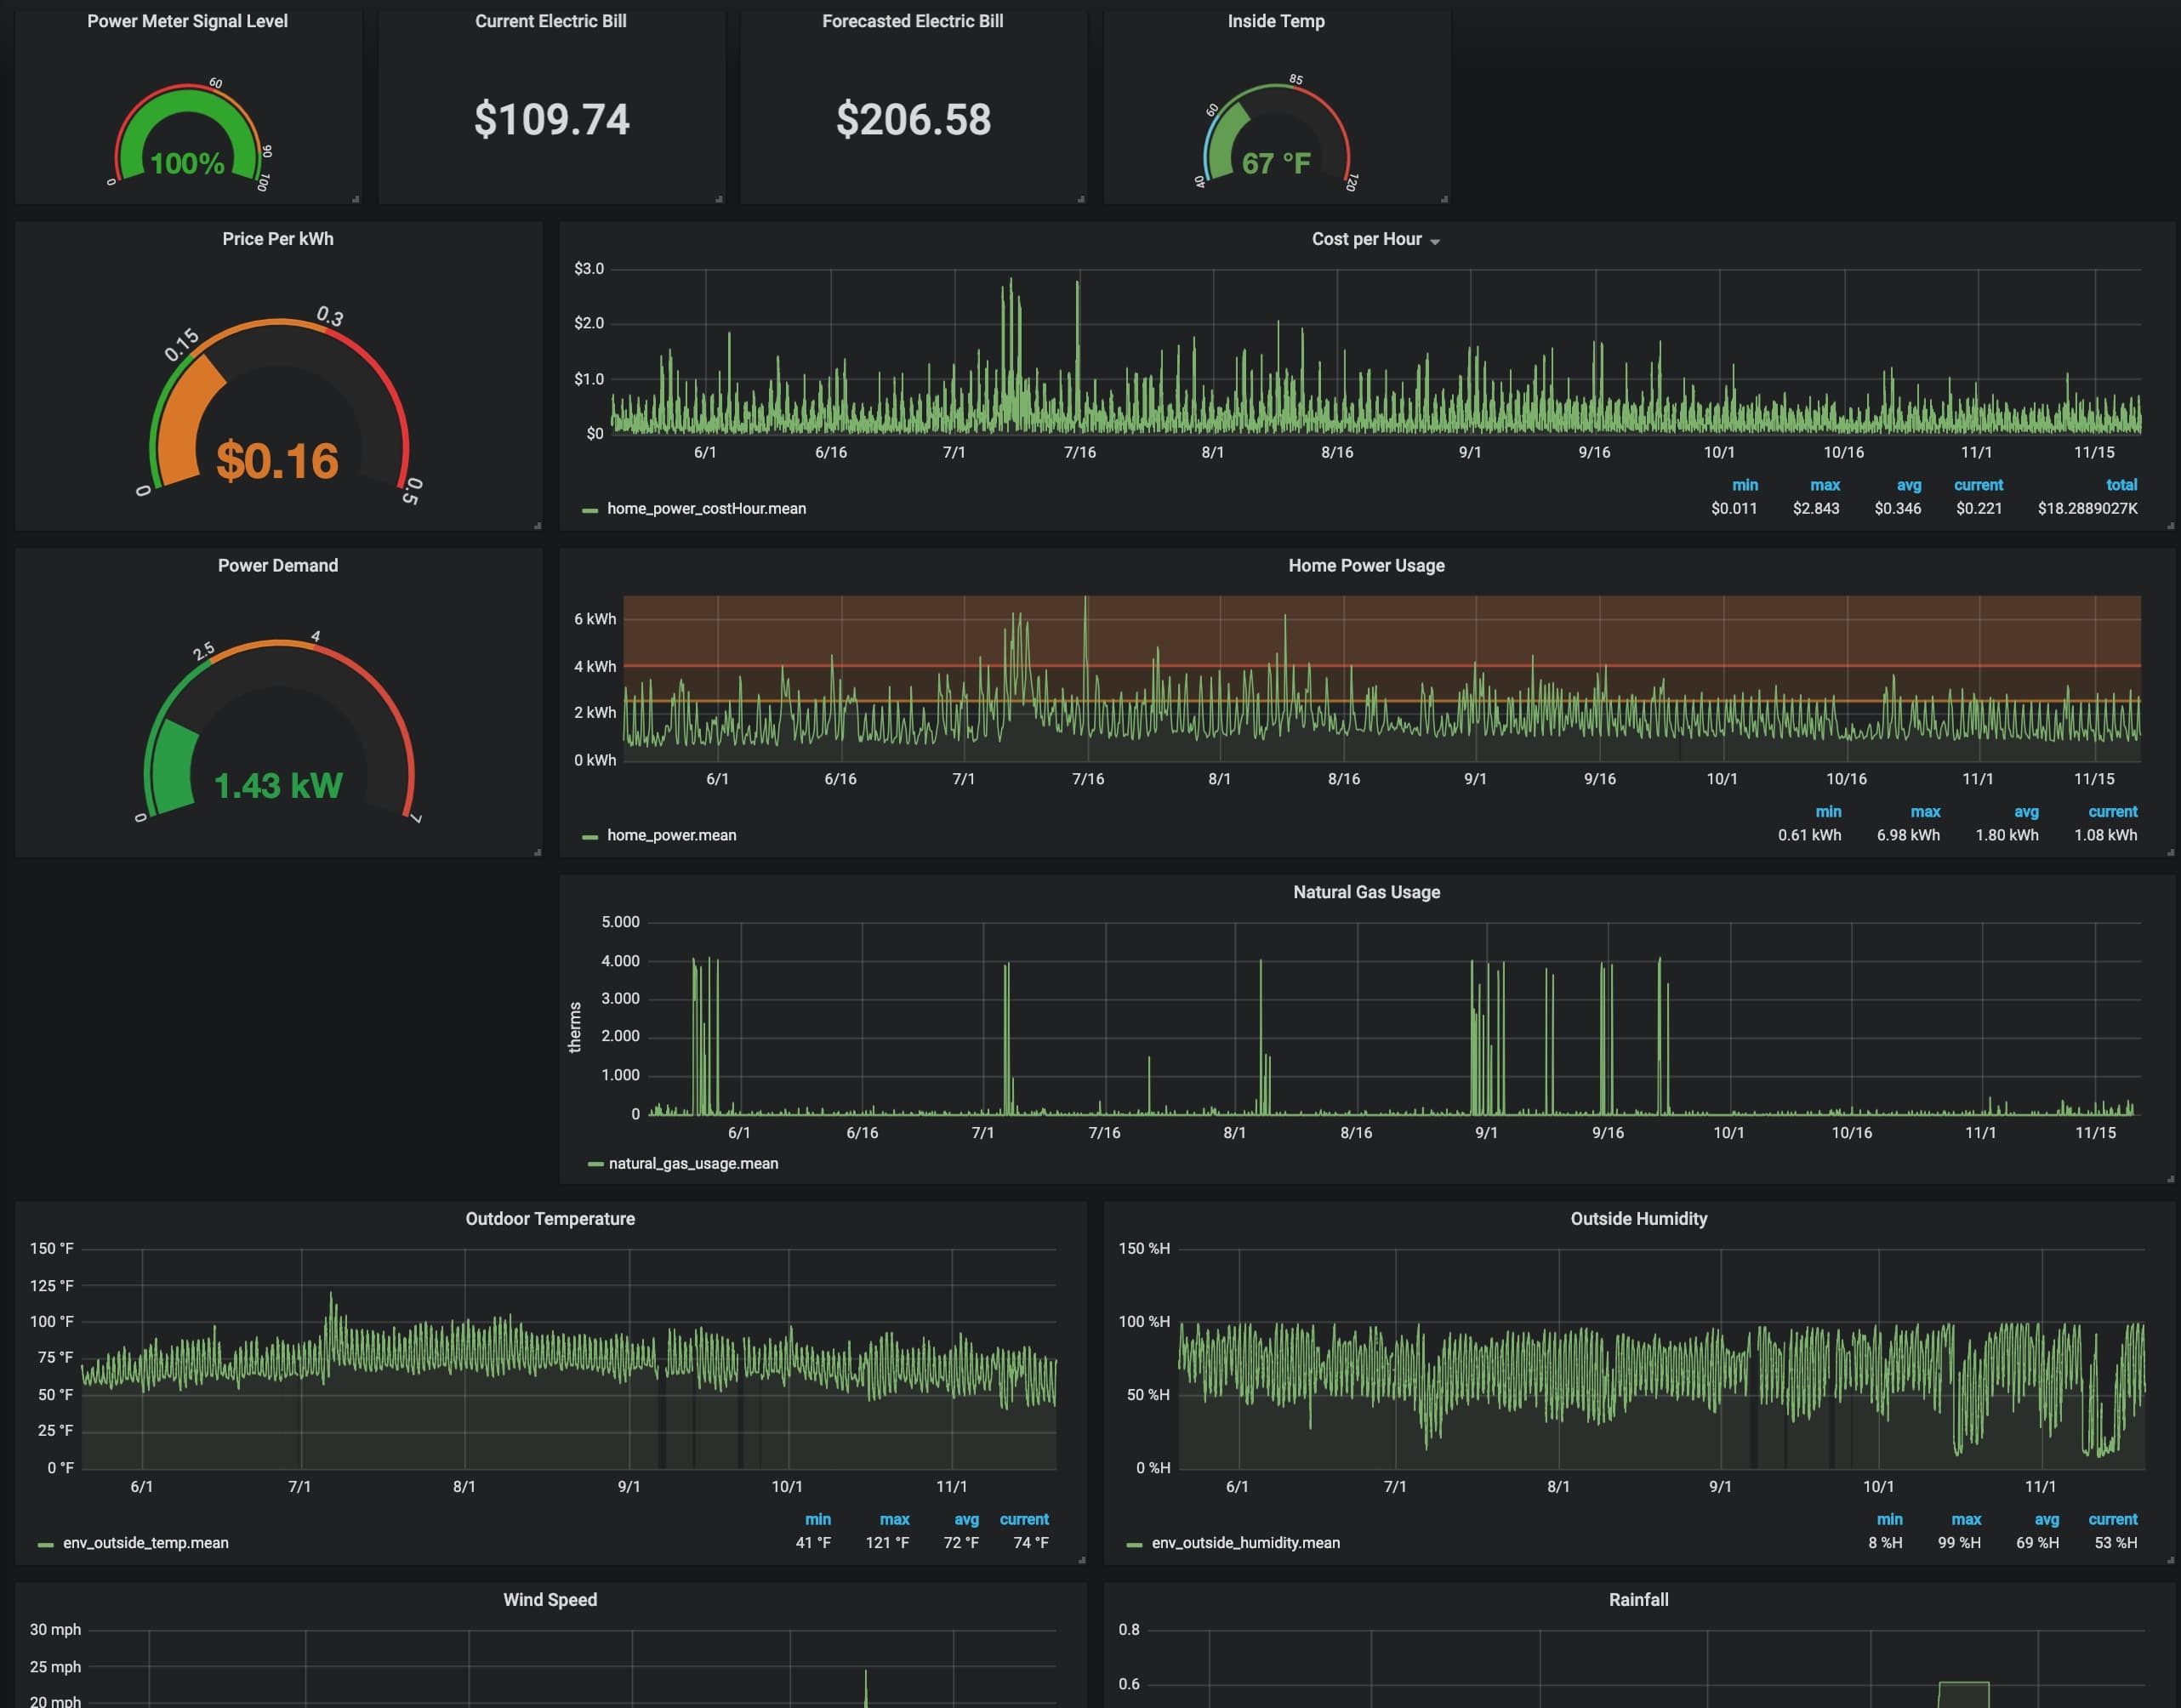
they did document their api. once i had a basic understanding of how they use multipliers, and all data is xml, and in hex format, i was able to construct a series of flows that digest this information via post from the rainforest meter. since switching from domestic to Time of Use, and having visual representation of our homes power usage availabe at a glance, i've been able to cut my electric bill by 60%.
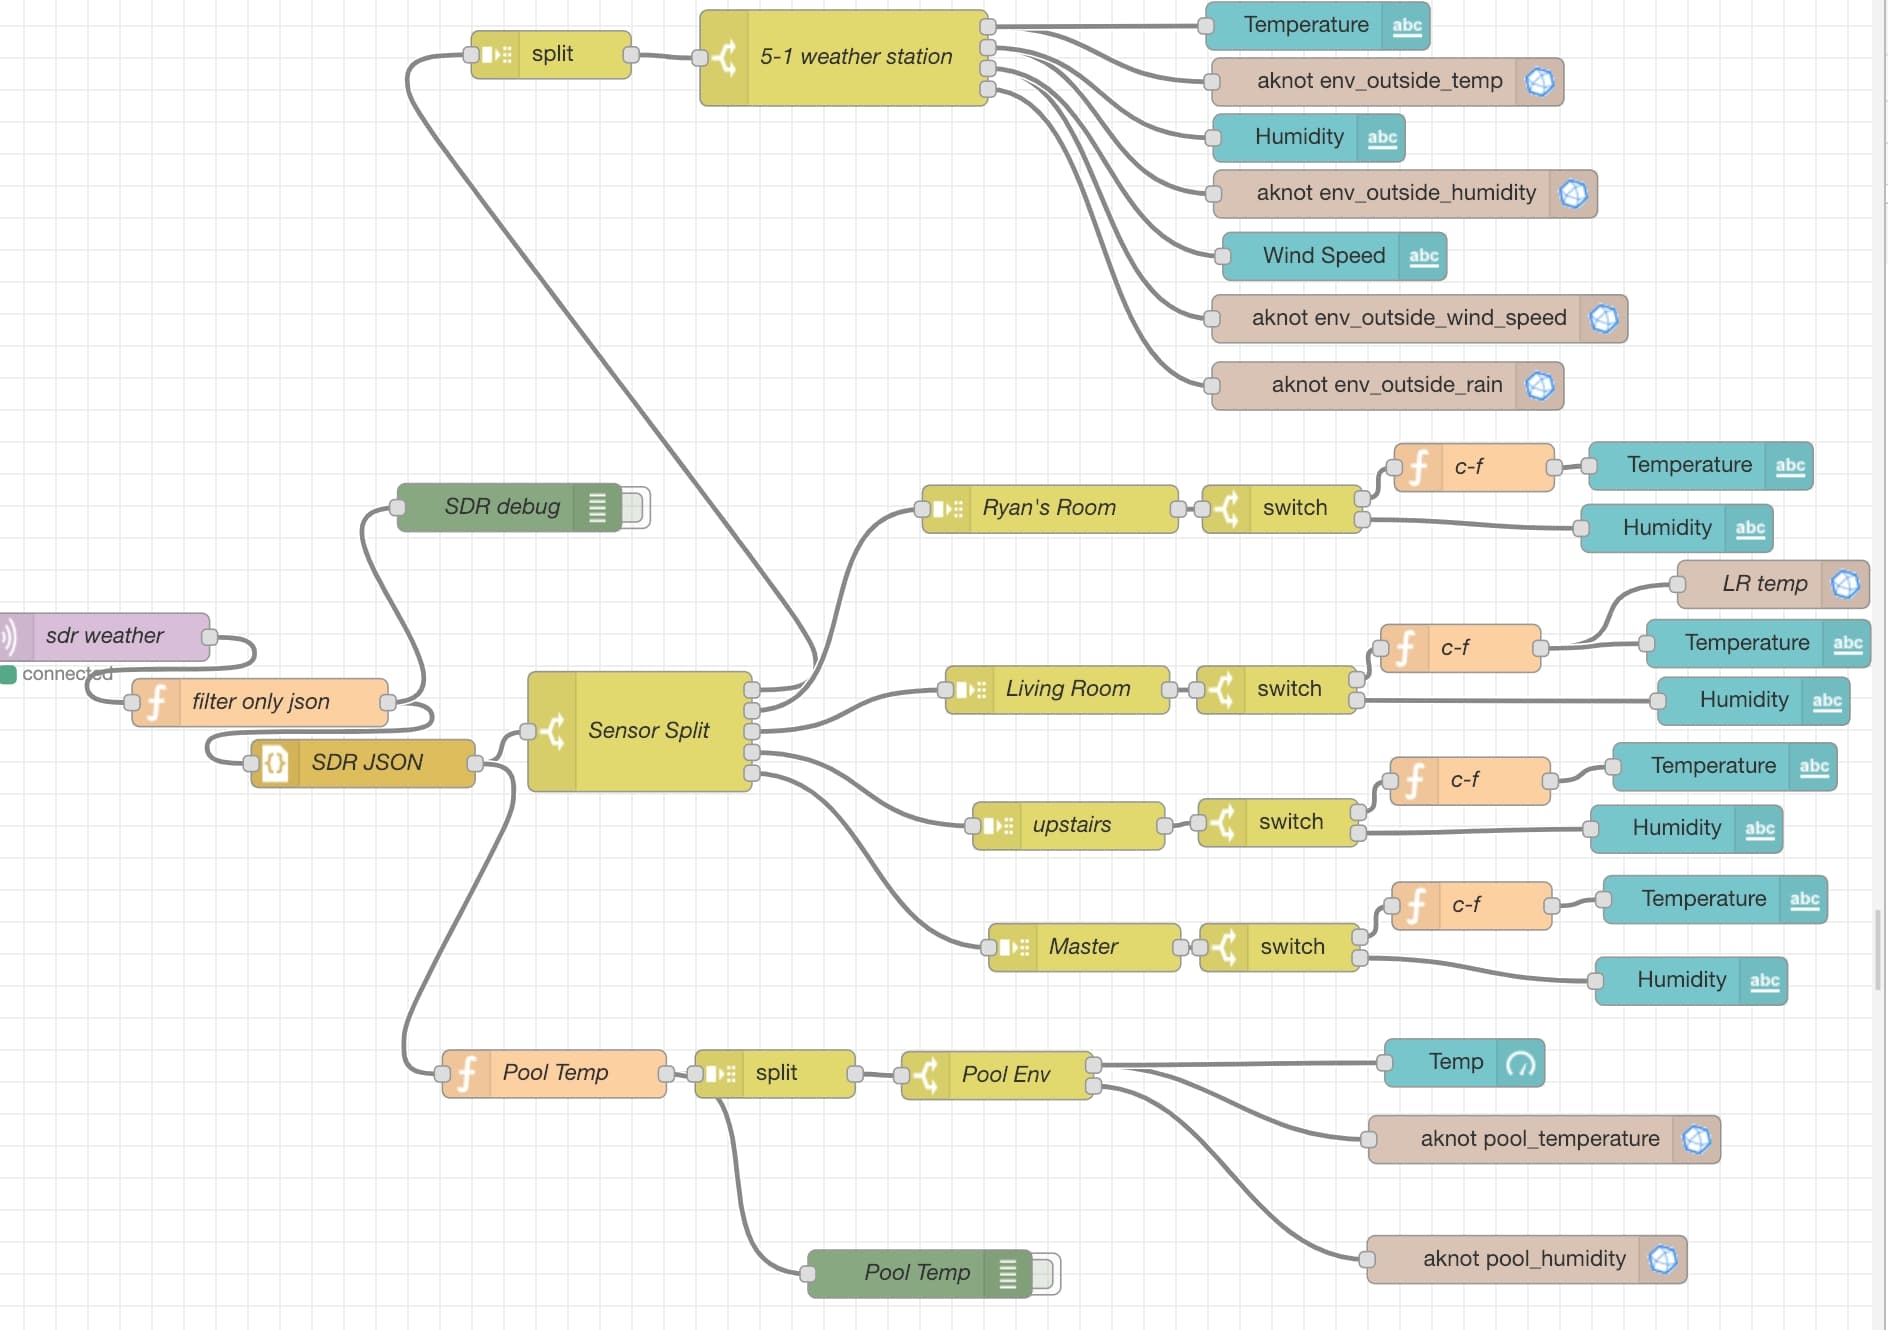
the flows that handle this data look like this.
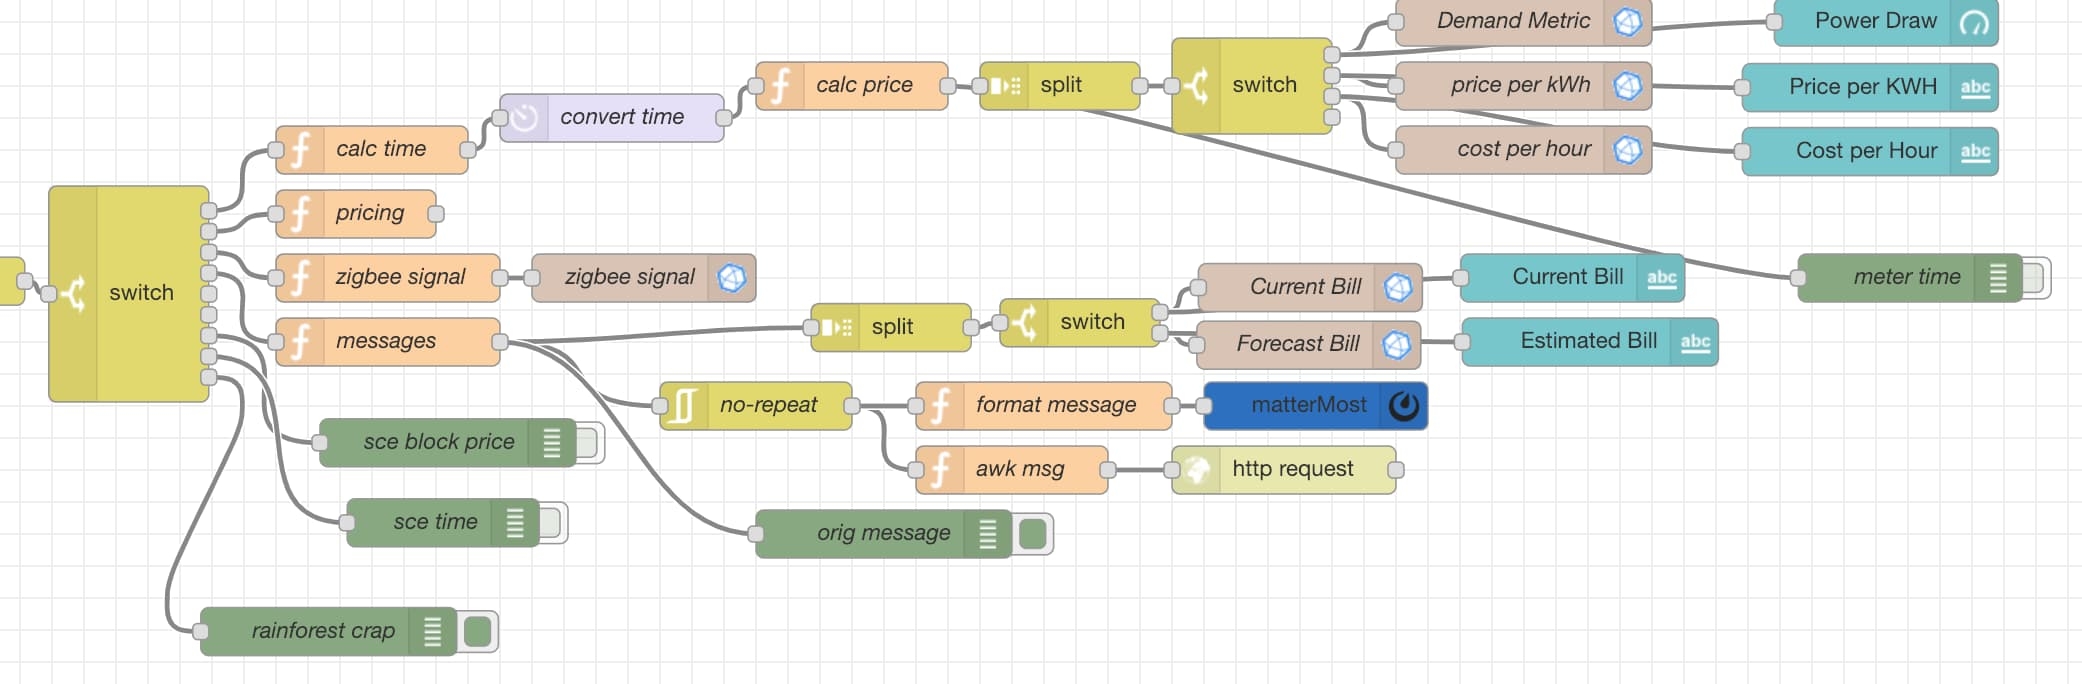
i've broken out the various important pieces below, its all javascript and TOU is hardcoded, but i hope to write that into some DB or something so it can change based on summer/winter shifts. but it does handle time and what not.
meter time extraction before passing it to the next node.
// 800-1359,2000-2159 = 0.16
// 1400-1959 = 0.23
// 2200-759 = 0.13
var hexTime=msg.payload.InstantaneousDemand[0].TimeStamp[0]
var decTime= parseInt(hexTime);

msg.meterTime = decTime + 946684800;
msg.meterTime = msg.meterTime * 1000;

return msg;
then the calculations for demand, and costs.
// get current date
var day = new Date();
msg.meterDay = day.getDay();

// parse costs
strDemand=msg.payload.InstantaneousDemand[0].Demand[0];
intDemand=parseInt(strDemand,16);

strMultiplier=msg.payload.InstantaneousDemand[0].Multiplier[0];
intMultiplier=parseInt(strMultiplier,16);

strDivisor=msg.payload.InstantaneousDemand[0].Divisor[0];
intDivisor=parseInt(strDivisor,16);

if (intDemand>2147483647) {
    intDemand = 0;
}

if (intMultiplier===0) {
    intMultiplier = 1;
}

if (intDivisor===0) {
    intDivisor = 1;
}
// set current demand
var curDemand = (intDemand * intMultiplier) / intDivisor;

// set a time that we can estimate on
var curTime = msg.meterTime.hours + "." + msg.meterTime.minutes;
curTime = parseFloat(curTime);

// calculate usage costs
var curPrice = 0;

// mon-fri
if (msg.meterDay < 6) {
    // 8 am to 2pm
    if ((curTime >= 8) && (curTime <= 13.59)) {
        curPrice = 0.16;
    }

    // 2pm to 8pm
    if ((curTime >= 14) && (curTime <= 19.59) ) {
        curPrice = 0.25;
    }

    // 8pm to 10pm
    if ((curTime >= 20) && (curTime <= 21.59) ) {
        curPrice = 0.16;
    }

    // 10pm to midnight
    if ((curTime >= 22)) {
        curPrice = 0.13;
    }

    // 0 to 759
    if (curTime <= 7.59) {
        curPrice = 0.13;
    }
} else {
    // sat & sun

    // 8 am to 10pm
    if ((curTime >= 8) && (curTime <= 21.59)) {
        curPrice = 0.16;
    }

    // 10pm to midnight
    if ((curTime >= 22)) {
        curPrice = 0.13;
    }

    // 0 to 759
    if (curTime <= 7.59) {
        curPrice = 0.13;
    }
}

// calculate costs
var usageCosts = (curDemand * curPrice) * 100;
usageCosts = Math.ceil(usageCosts) / 100;

// calculate demand
msg.payload.curTime = curTime;
msg.payload.currentPrice = curPrice;
msg.payload.usageCostHours = usageCosts;
msg.payload.demand = curDemand;

return msg;
from there its split off into a match for storing in influxdb.
you can also get utility daily bill notices, its your bill to date, and estimated bill, i extract it like this.
if (msg.payload.MessageCluster) {
msg.payload = msg.payload.MessageCluster[0];
if (msg.payload.Id[0]) {
var body = msg.payload.Text[0];
var bill = extractBill(body);
msg.payload.curBill = parseFloat(bill[1]);
msg.payload.forecastBill = parseFloat(bill[2]);
return msg;
}
}
function extractBill(data) {
var rx = /.*Date \$(.*)\,.*Forecast \$(.*)\,.*/g;
var arr = rx.exec(data);
return arr;
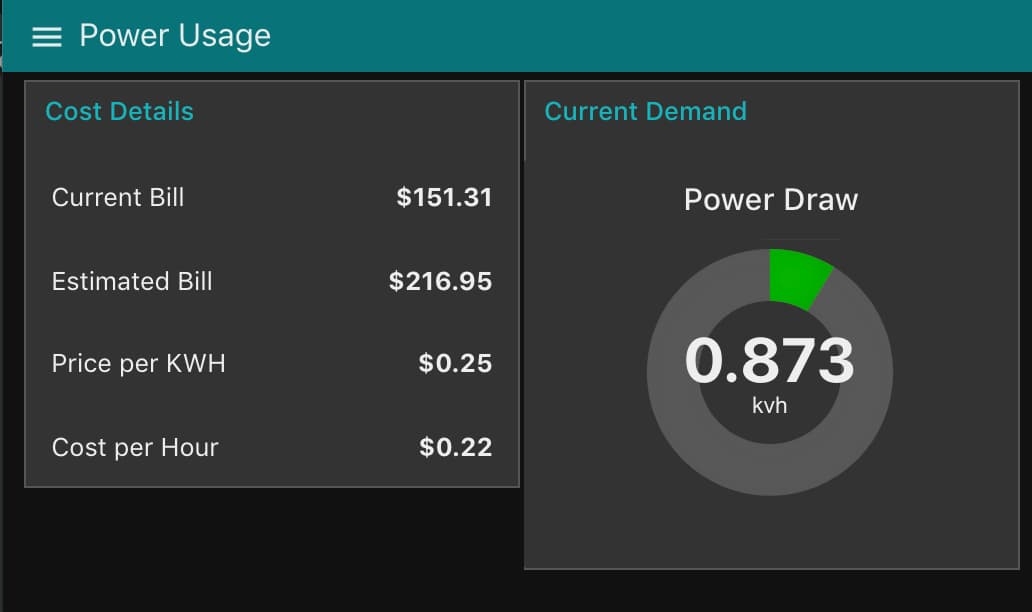
}with this data and the weather sensor data in the next section, you get an output in grafana that looks like this.
the mounted touchscreens have a view like this
you'll notice in the above grafana screen that i also have natural gas graphed. this is a recent addition. socal gas provide this usage history green button program. its in their web, and requires you to go through the login process, but you can download years worth of information (since they first put in your smart meter, i think its been just over 2 years) with that xml file, and a style sheet, you can do some math to calculate that data and insert it into influxdb.
my parsing code for socalgas is here
weather stations and sensors
gathering weather data was annoying at first. i bought a acurite weather station with internet hub on ebay. it was a great deal. the hub as the ability to push to weatherunderground, and thats it. i read about a few different people who intercepted the traffic on its way but i found this wasn't reliable. eventually they discontinued the old version and i got the new version for really cheap as an existing customer. this had a lot more security and had no possibility of interception.
eventually i came across rtl_433, this software allows you to use an software defined radio to read the 433mhz frequency of the weather stations, it can match by id, or just capture all of them. with a few flags i can convert it to JSON and post it to mqtt to be injested by node-red
rtl_433 -G -F json -U | mosquitto_pub -t home/weather -l -h mqtt.host.com
node-red matches based on deviceID usually doesn't change, only sometimes on battery replacements. the flows look like this
misc stuff
i have a raspberry pi that is dedicated for communications stuff, it has a 4G and GPS hat on it, and an SDR hooked up. its responisble for backup internet, gps time server, and gathering weather data from the various weather sensors.
i've been playing with googles dialog flow so that i can start controllling all this with my voice, i just havn't had time to get it working.
also as i have time i'll try populating this page with more details on the actual flow content for node-red.
Add a comment
